Bar Graph vs Line Graph: Which One Should You Use?
By @akooms, founder of LLMVIZ·Published
The short answer: use a bar graph to compare separate categories or amounts, like sales by region. Use a line graph to show how one thing changes over time, like signups by month. If your data is a time series and the trend is the point, pick the line. If the size of each item is the point, pick the bars.
Quick note on names: a bar graph and a bar chart are the same thing. So are a line graph and a line chart. This post uses both.
Bar graph vs line graph at a glance
| Bar graph | Line graph | |
|---|---|---|
| Best for | Comparing categories or amounts | Showing change over time |
| The horizontal axis shows | Separate categories (or a few time periods) | An ordered sequence, usually time |
| What it makes obvious | Which item is biggest or smallest | Trends, growth, dips, and turning points |
| Data type | Categories with a value each | Values measured in order |
| Number of points | Works best under about 15 bars | Handles dozens or hundreds of points |
| Avoid when | You have many time points (it turns into a barcode) | Your categories have no natural order |
Bottom line: bars compare, lines track. When your data is time-based, ask yourself which question the reader needs answered: "how big was each period?" (bars) or "where is this heading?" (line).
When to use a bar graph
A bar graph shows a value for each category as a bar, so the reader can compare lengths at a glance. It is the right choice when the categories are separate things and their order does not mean anything on its own.
Use a bar graph when you want to:
- Compare categories: revenue by product, votes by option, survey answers by group.
- Rank things: the top 10 countries by users. Sort the bars, and use horizontal bars if the labels are long.
- Compare a few time periods: this year vs last year, or four quarters, where the size of each period matters more than the trend.
When to use a line graph
A line graph plots values in order and connects them, so the eye follows the direction of change. It is the right choice when the horizontal axis is a sequence, almost always time, and the shape of the change is the story.
Use a line graph when you want to:
- Show a trend: monthly active users, weekly sales, daily temperature.
- Spot turning points: where growth started, stalled, or reversed.
- Compare a few trends: two or three lines on one chart. More than four and it gets hard to read.
Same data, two charts: a real example
Here is real data from LLMVIZ itself: how many charts people made on the site each month in 2026. We indexed it so the busiest month equals 100, which shows the pattern without sharing raw totals. November only covers November 1 to 22.
I pasted it into LLMVIZ as plain text:
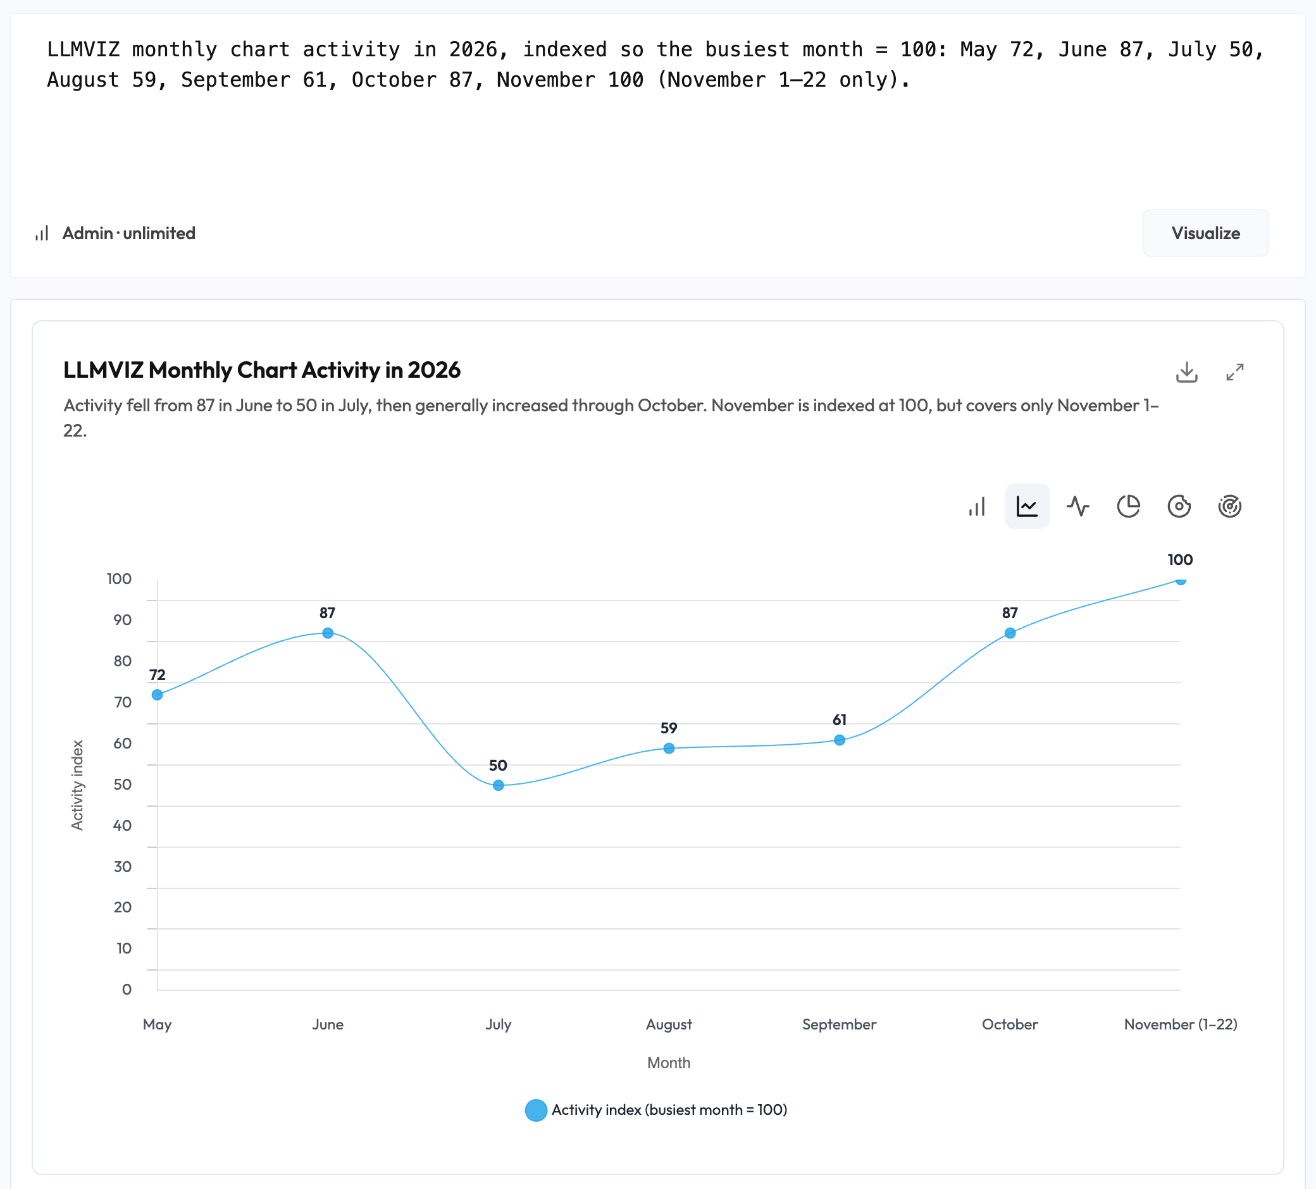
LLMVIZ picked a line chart on its own, because the data is a time series. Here is the same data both ways.
As a bar graph:
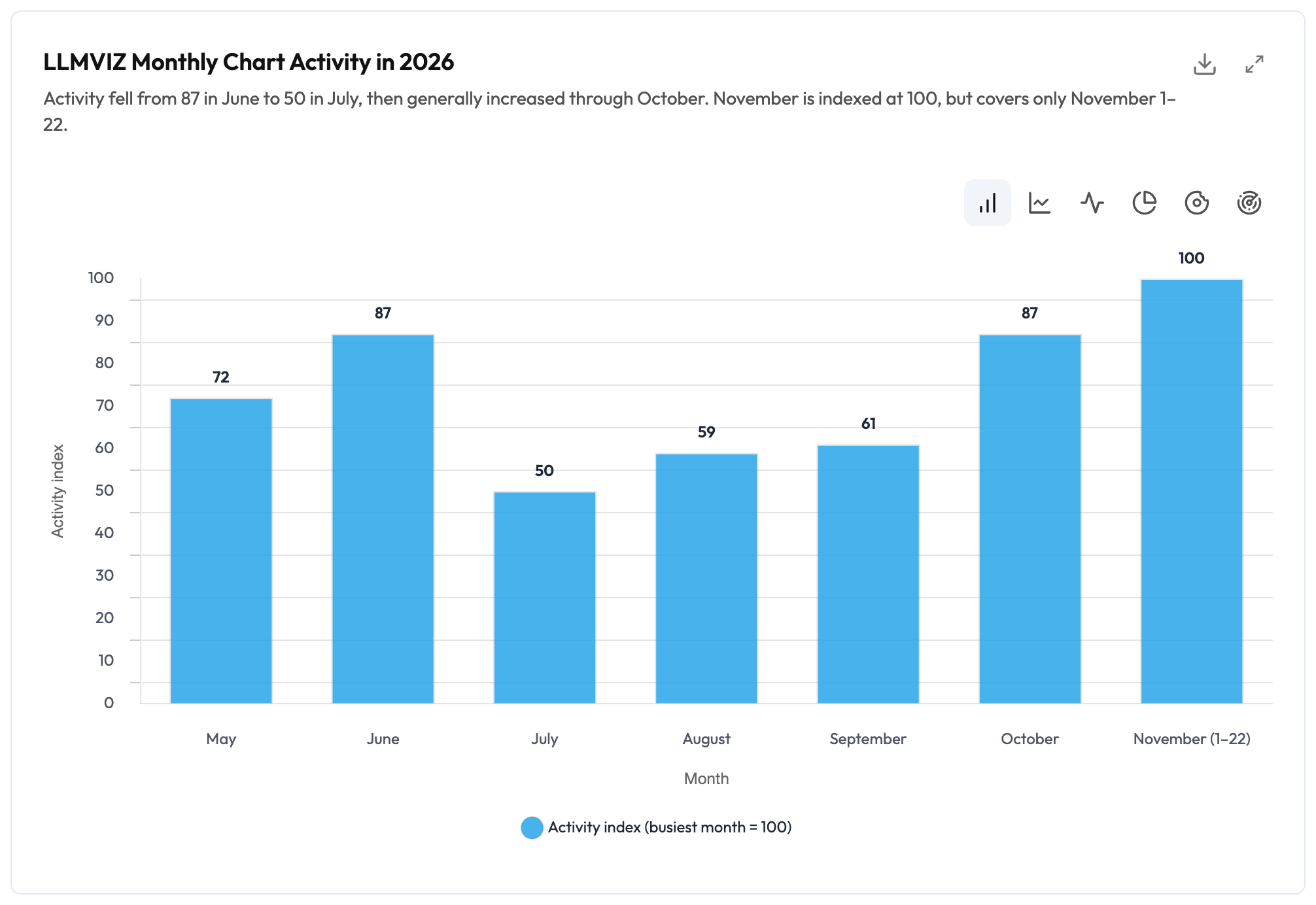
The bars answer "how did each month compare?" You can read every value. July is clearly the smallest month, and June and October are tied at 87.
As a line graph:
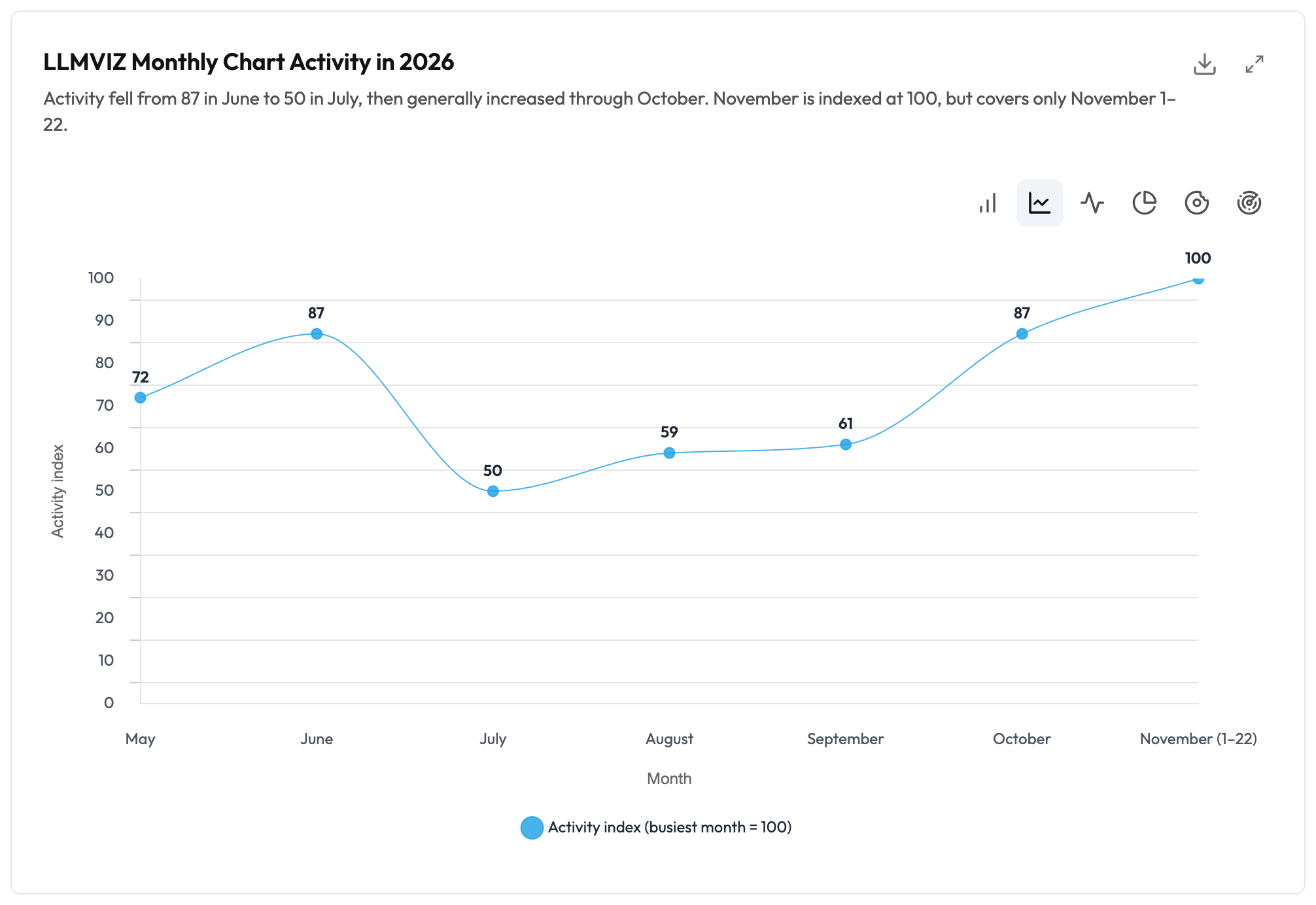
The line answers "where is this heading?" It shows a story the bars only hint at: a sharp drop from June to July (down about 43%), a slow two-month recovery, then a climb to a new high.
Neither chart is wrong. They answer different questions. For a monthly report where each number matters, use the bars. For a "how are we trending" slide, use the line.
Which one should you use?
| Your data | Use |
|---|---|
| Separate categories (regions, products, channels) | Bar graph |
| Change over time with many points | Line graph |
| A few time periods, focus on the size of each | Bar graph |
| A trend, growth rate, or turning point | Line graph |
| A ranking | Bar graph (often horizontal) |
| Parts of a whole that add up to 100% | Neither. Try a pie or donut chart |
What people actually chart on LLMVIZ
Of the charts LLMVIZ generated from users' pasted text between May and November 2026, about half were bar charts, a quarter were line charts, and about a fifth were pie charts.
"Half the charts people make on LLMVIZ end up as bar charts. Most of what gets pasted in compares things. Trends over time show up less often, but when they do, a line chart tells the story a bar chart hides."
@akooms, founder of LLMVIZ
Common mistakes to avoid
- Drawing a line between unrelated categories. A line from "Google Ads" to "LinkedIn Ads" implies a trend between them. There isn't one. Use bars.
- Using bars for dozens of time points. Fifty thin bars read like a barcode. Switch to a line.
- Starting a bar graph's axis above zero. Bar length is the value, so a cut-off axis makes small differences look huge. Line graphs can zoom in on a range, because the reader is judging the slope, not the length.
- Letting a smoothed line invent values. Curved, smoothed lines can bend above or below the real data points between them. If exact values matter, use straight segments or show the points.
- Spacing uneven time periods evenly. If you skip a month, a line graph that spaces every point the same distance apart hides the gap. Show missing periods or note them.
Frequently asked questions
Can you combine a bar graph and a line graph?
Yes. A combo chart shows bars and a line on the same axes, often with a second vertical axis, for example monthly revenue as bars and growth rate as a line. They are useful but easy to misread. LLMVIZ does not make combo charts, so if you need both views, show a bar chart and a line chart side by side.
Is a bar chart the same as a bar graph?
Yes. "Bar chart" and "bar graph" mean the same thing, and so do "line chart" and "line graph." Some tools, like Excel, call vertical bars a "column chart" and save "bar chart" for horizontal bars. It is the same idea.
What is the difference between a bar graph and a histogram?
A bar graph compares separate categories, and its bars have gaps between them. A histogram shows how numeric data is distributed, like how many people fall into each age range, and its bars touch because the ranges are continuous.
When should I use a line graph instead of a scatter plot?
Use a line graph when your points have a natural order, like time, and connecting them makes sense. Use a scatter plot to show the relationship between two numeric measures, like ad spend and sales, where the points have no order to connect.
When should I use a pie chart instead of a bar graph?
Use a pie chart only when the values are parts of one whole that add up to 100%, and there are about five slices or fewer. For anything else, a bar graph is easier to read, because people compare lengths more accurately than angles.
How many lines can a line graph have?
Keep it to about three or four. Past that, lines cross and colors blur together. If you need more, highlight one or two lines and gray out the rest, or split them into small separate charts.
Make your own
Have numbers in a report, a spreadsheet, or an AI answer? Paste them into LLMVIZ and switch between a bar and a line chart with one click.
Try the examples with no account. Free accounts get 3 charts a day, no watermark.
Or go straight to the bar graph maker or the line graph maker. Not sure which chart fits your data at all? See every chart type.
Sources: National Center for Education Statistics, How Do I Choose Which Type of Graph to Use?. LLMVIZ usage data, May to November 22, 2026.